
 reslumen
Note
Go to the end to download the full example code.
Plotting a sine#
An introductory example: a Matplotlib figure, some narrative between the code blocks, and mathematics rendered with MathJax.
A gallery script starts with a triple-quoted docstring written in
reStructuredText, whose first line is the title of the example. Code and text
blocks follow it; a line beginning with # %% starts a new block, and a
comment block after it is rendered as prose rather than as code.
Mathematics is written as it is anywhere else in the documentation. This example plots
where \(\sin\) is evaluated at every point of \(x\). Escape the backslashes when the mathematics is inside a plain docstring, or make the docstring raw.
import matplotlib.pyplot as plt
import numpy as np

try:
    import mplstyle_reslumen  # noqa: F401

    plt.style.use("reslumen")
except ImportError:
    pass

x = np.linspace(0, 2 * np.pi, 100)
y = np.sin(x)

plt.plot(x, y)
plt.xlabel(r"$x$")
plt.ylabel(r"$\sin(x)$")
plt.show()
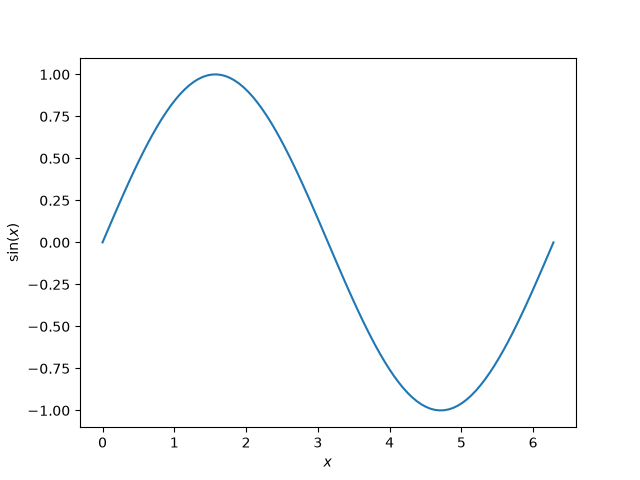
Text blocks and code blocks alternate, so the narrative can explain what the code below it is about to do. Output printed by a block is captured and shown under it:
print("This example shows a sine plot.")
This example shows a sine plot.
Cross-referencing#
Every example gets a label of its own, so one example can link to another with an ordinary reference — see Choosing the thumbnail of an example for the example that chooses its own thumbnail.
Note
Directives work here exactly as they do on a hand-written page.
Total running time of the script: (0 minutes 0.178 seconds)